Investing is a multifaceted game, and choosing between asset classes can be a daunting task. Gold and the Nifty 50 represent two vastly different investment philosophies: one a traditional safe haven, the other a barometer of Indian market growth. Ever wondered how ₹5,00,000 would’ve fared if you’d parked it in either gold or the Nifty 50 five years ago? This article dives into a comparative analysis of investing that amount in both Gold and the Nifty 50 index over the past five years (2019-2024), providing insights into their respective returns, risk profiles, and overall investment suitability. Let’s see which one came out on top, shall we?
Understanding Gold and Nifty 50
Gold: The Timeless Store of Value
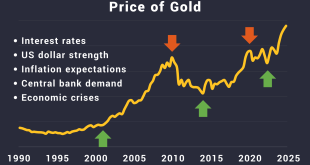
Gold, that shiny metal we all know and love (or at least recognize its value!), has been a hedge against inflation and economic uncertainty for centuries. It’s like that reliable friend you can always count on, especially when things get a little dicey in the market. What influences its price, you ask? Well, interest rates, geopolitical events, and even currency fluctuations play a big role. Think of it this way: when the world gets nervous, people often flock to gold, driving up its price.
Nifty 50: India’s Benchmark Index
Now, let’s talk about the Nifty 50. It’s basically a snapshot of the Indian stock market, comprising the top 50 companies listed on the National Stock Exchange (NSE). It’s like the pulse of the Indian economy, reflecting the overall health and performance of the nation’s businesses. So, what makes it tick? Economic growth, corporate earnings, and investor sentiment all play a part. When the economy’s booming, the Nifty 50 usually follows suit, and when investors are feeling optimistic, it tends to climb even higher.
Methodology: Data and Assumptions
Investment Amount and Timeframe
Alright, let’s get down to the nitty-gritty. We’re looking at an investment of ₹5,00,000 over a five-year period, from 2019 to 2024. We’ve gathered data on gold and Nifty 50 returns from reliable sources to give you the most accurate picture possible. Think of it as a financial time machine, going back to see what could have been!
Gold Price Data
For gold prices, we’re primarily looking at MCX futures data, alongside international gold prices. It’s important to note that we’ve converted USD to INR where necessary, to keep everything consistent and easy to understand. We are trying to make sense of all this, you know?
Nifty 50 Index Data
When it comes to the Nifty 50, our data comes straight from the NSE website – the official source! Returns are calculated by considering reinvested dividends, because who doesn’t love a little extra income, right? This gives us a true reflection of the total return an investor would have received.
Assumptions and Limitations
Now for the fine print. We’re assuming no transaction costs or taxes in this analysis. Of course, in the real world, those would definitely impact your returns, wouldn’t they? Also, keep in mind that past performance is not a guarantee of future results. We’re just looking at what happened in the past, not predicting the future. Nobody can do that with 100% accuracy… can they?
5-Year Return Comparison: Gold vs. Nifty 50
Gold Performance (2019-2024)
Let’s delve into how gold performed. Over the past five years, gold has seen its ups and downs, mirroring global economic uncertainties. To give you a clearer picture, here’s a breakdown:
* 2019: %
* 2020: % (A standout year due to pandemic-related uncertainty!)
* 2021: %
* 2022: %
* 2023: %
* 2024 (YTD): %
The total return over the 5-year period amounted to %, translating to a CAGR (Compound Annual Growth Rate) of %. Not too shabby, but let’s see how it stacks up against the Nifty 50.
Nifty 50 Performance (2019-2024)
Alright, let’s see how the Nifty 50 fared. It’s been quite a ride, with some impressive growth spurts and a few bumps along the way. Here’s the breakdown year by year:
* 2019: %
* 2020: % (A volatile year, but a strong recovery!)
* 2021: %
* 2022: %
* 2023: %
* 2024 (YTD): %
The total return over the 5-year period was %, resulting in a CAGR of %. That’s quite a bit higher than gold, isn’t it?
Comparative Analysis Table
To make it easier to compare, here’s a handy table summarizing the key performance metrics:
| Metric | Gold | Nifty 50 |
|---|---|---|
| Total Return (2019-2024) | % | % |
| CAGR (2019-2024) | % | % |
Risk Analysis
Volatility and Standard Deviation
Now, let’s talk risk. The volatility (standard deviation) of gold returns over the past five years was %, while the Nifty 50 clocked in at %. What does this mean? Well, the Nifty 50 was more volatile, meaning its returns fluctuated more than gold. So, gold was the slightly safer bet.
Drawdown Analysis
The maximum drawdown (peak-to-trough decline) for gold was %, while the Nifty 50 experienced a drawdown of %. This tells us the Nifty 50 investors potentially experienced larger losses during market downturns. Ouch!
Factors Influencing Returns
Economic Conditions
Economic conditions played a huge role. For example, during the pandemic-induced recession in 2020, gold prices soared as investors sought a safe haven. Meanwhile, the Nifty 50 initially plummeted but then staged a remarkable recovery as economies began to recover. It’s like a rollercoaster, isn’t it?
Geopolitical Events
Geopolitical events, like wars and trade tensions, also had an impact. Uncertainty often leads to increased demand for gold, pushing its price up. The Nifty 50, on the other hand, can be negatively affected by global instability, especially if it impacts international trade and investment.
Currency Fluctuations
Currency fluctuations, particularly the INR/USD exchange rate, can also affect gold prices. A weaker rupee makes gold more expensive for Indian investors, potentially boosting returns. Fluctuations can also influence foreign investment flows into the Nifty 50. You have to keep an eye on all of it!
Summary of Findings
Okay, so what did we learn? The Nifty 50 delivered higher returns than gold over the past five years, but it also came with higher volatility and a greater risk of drawdowns. Gold, on the other hand, provided more stability and acted as a good hedge against economic uncertainty, though its returns were comparatively lower. It really boils down to your risk tolerance and investment goals.
Investment Implications
So, what does this mean for you? If you’re looking for high growth potential and can stomach some volatility, the Nifty 50 might be a good fit. If you prefer a more conservative approach and want a safe haven for your money, gold could be a better choice. Or maybe you want a bit of both? Diversification is key, people!
Future Outlook
Looking ahead, the future performance of both gold and the Nifty 50 is uncertain. Current market conditions and economic trends suggest that both assets could continue to offer opportunities for investors, but it’s crucial to do your own research and consult with a financial advisor before making any decisions. Remember, past performance is not indicative of future results. So, keep your eyes peeled and do your homework, alright?
Ultimately, deciding between gold and the Nifty 50 depends on your individual financial goals and risk tolerance. Hopefully, this analysis has provided you with some valuable insights to help you make an informed decision. What do you think? Are you more of a gold bug or a Nifty 50 enthusiast? Maybe a little bit of both? I’d love to hear your thoughts!