What are Gold Futures?
Alright, let’s break it down. Gold futures are basically contracts. You’re agreeing to buy or sell a certain amount of gold at a specific price on a set date in the future. Think of it as placing a bet on where you think the price of gold is headed. It’s traded on exchanges, so you gotta go through a broker to get in on the action. You’re not actually taking delivery of a giant pile of gold bars… unless you want to, I guess? But most people are just speculating, trying to make a profit off the price changes.
Key Components of a Futures Contract
Listen, before you jump in, you’ve gotta know the lingo. Contract size matters – that’s how much gold you’re trading. Delivery date tells you when the contract expires. And tick size? That’s the smallest price movement possible. It all impacts your profit or loss, so, yeah, do your homework. Ignoring this stuff is like trying to bake a cake without a recipe. Sure, you might get lucky, but probably not.
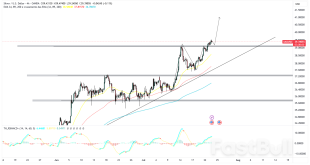
Real-Time Data
This is the heart of the whole thing. Forget delayed quotes. You need to see the price as it happens. Streaming charts give you that edge. It’s like watching a movie instead of reading a summary. You get the whole picture, the ups and downs, the little details that can make all the difference.
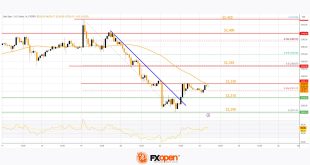
Interactive Charting Tools
Okay, now we’re getting fancy. These charts aren’t just static pictures. You can mess with ’em! Change the timeframe to see short-term blips or long-term trends. Throw on some technical indicators, which we’ll get to in a sec. Draw some lines to spot patterns. It’s like being a detective, but with charts. I personally love playing around with different indicators, sometimes I feel like a mad scientist mixing potions!
Order Book and Depth of Market
This is where things get really interesting. The order book shows you all the buy and sell orders that are out there, at different price levels. Depth of market gives you an idea of how much buying or selling pressure there is. Seeing a huge wall of buy orders at a certain price? That might be a sign of strong support. It’s like peeking behind the curtain, getting a glimpse into the collective mindset of the market. You don’t have to use it, but, hey, more info never hurt anyone.
Using Technical Indicators
Moving Averages
Okay, so moving averages. They smooth out the price data, making it easier to spot the trend. A 50-day moving average shows you the average price over the last 50 days. It helps you see through the daily noise. When the price is above the moving average, it suggests an uptrend. Below? Downtrend. It’s not foolproof, but it’s a handy tool to have in your arsenal.
Relative Strength Index (RSI)
RSI is like a temperature gauge for the market. It tells you if gold futures are overbought (likely to go down) or oversold (likely to go up). Numbers over 70? Overbought. Under 30? Oversold. Don’t treat it as gospel, though. Markets can stay overbought or oversold for a while. It’s just another piece of the puzzle.
MACD (Moving Average Convergence Divergence)
MACD, what a mouthful! It’s all about the relationship between two moving averages. When the MACD line crosses above the signal line, that can be a buy signal. Crosses below? Sell signal. It’s a bit more complex than just looking at the price chart, but some traders swear by it. Everyone has their favorite secret sauce, right?
Interpreting Chart Patterns
Head and Shoulders
Okay, this one’s a classic. It looks like, well, a head and shoulders. The “head” is a higher peak, with a shoulder on either side. It signals that the uptrend might be losing steam and about to reverse. It’s like the market is saying, “I’m tired, I’m gonna go down now.”
Double Top and Double Bottom
These are pretty straightforward. A double top is when the price tries to go higher twice, but fails both times. A double bottom is the opposite, where the price tries to go lower twice, but can’t break through. Both are potential reversal signals. Simple, but effective.
Triangles and Wedges
Triangles and wedges… these can be tricky. Symmetrical triangles often mean the price is consolidating, waiting for a breakout. Ascending triangles are usually bullish, descending triangles are usually bearish. Wedges can signal reversals or continuations. It’s all about context and confirmation. Reading the pattern is like reading tea leaves, but maybe slightly more reliable?
Risk Management Considerations
Stop-Loss Orders
Seriously, always use stop-loss orders. It’s a non-negotiable. A stop-loss is an order to automatically sell your position if the price hits a certain level. It limits your losses if the trade goes against you. Think of it as your insurance policy. Never trade without one.
Position Sizing
Don’t bet the farm on a single trade. Size your positions appropriately. A common rule of thumb is to risk no more than 1-2% of your trading capital on any one trade. It might seem small, but it protects you from blowing up your account. Small consistent gains are better than huge losses.
Understanding Leverage
Gold futures trading involves leverage, which means you can control a large position with a relatively small amount of capital. This can amplify your profits, but it can also amplify your losses. Make sure you understand how leverage works before you start trading. It’s a powerful tool, but it can be dangerous if you don’t know what you’re doing. So tread carefully!
So, armed with real-time data, the right tools, and solid risk management, you’re in a much better position to navigate the gold futures market. Remember that it’s not a get-rich-quick scheme. It takes time, practice, and a healthy dose of humility. Don’t let emotions get the best of you. Stick to your plan. Learn from your mistakes. And maybe, just maybe, you’ll strike gold! Why not give these charts a try and see what you find? Or if you’ve had experience with these, what works for you?