Alright, let’s talk about something that might seem a bit dry but is actually pretty fascinating: predicting where gold prices are headed. Now, I know what you’re thinking – crystal balls and tea leaves, right? But it’s way more sophisticated than that. For investors, governments, heck, even jewelers, knowing what gold might do next is kinda a big deal. We’re going to explore a method called “pulse function intervention analysis.” Sounds complicated? Don’t worry, we’ll break it down. Basically, it helps us see how specific events mess with the price of gold. Think of it as detective work for the gold market. Ready to dig in?
Introduction to Gold Price Forecasting
The Importance of Accurate Gold Price Prediction
Why should you even care about predicting gold prices? Well, imagine you’re managing a huge investment portfolio. Knowing if gold is about to skyrocket or plummet could save you a ton of money—or make you a ton! Governments also use these forecasts for economic planning. And if you’re a small business owner who relies on gold, like a jeweler, this info is crucial for managing your inventory and pricing. It’s all about being prepared and making smarter decisions, wouldn’t you agree?
Traditional Forecasting Methods and Their Limitations
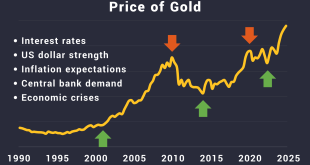
So, how have people tried to predict gold prices in the past? There are the usual suspects like time series analysis, which looks at past price movements to guess future ones. Then there’s regression analysis, which tries to find relationships between gold prices and other economic factors. But these methods often fall short because they struggle to account for sudden, unexpected events. Think about it: a major geopolitical crisis erupts, and suddenly gold goes crazy! Traditional models often can’t handle these kinds of “interventions.” It’s like trying to predict the weather without knowing a hurricane is coming.
Introducing Pulse Function Intervention Analysis
That’s where pulse function intervention analysis comes in. This approach is designed to specifically identify and measure the impact of those sudden, unexpected events – those “interventions” – on gold prices. A pulse function is basically a way of representing a short-term shock. The cool thing about this method is that it allows us to see not just if an event affected gold prices, but how much and for how long. It’s like giving your forecasting model a pair of glasses so it can see those unexpected bumps in the road. Pretty neat, huh?
Pulse Function Intervention Analysis: A Theoretical Framework
Understanding Intervention Analysis
Okay, let’s get a little more technical. Intervention analysis, at its heart, is about figuring out how an external event changes a time series – in our case, gold prices. Think of it like this: the price of gold is doing its thing, and then BAM! Something happens. A war breaks out, a new trade agreement is signed, whatever. Intervention analysis tries to isolate the effect of that specific event from all the other noise in the market. It’s like trying to figure out how much a single raindrop contributes to a flood.
The Role of Pulse Functions
So, where do these “pulse functions” fit in? A pulse function is a mathematical way of representing an event that has a sudden, temporary impact. It’s like a light switch: it’s either on (the event happened) or off (the event didn’t happen). This helps us model the immediate shock to the gold market caused by the intervention. If you are an old-school movie fan, remember the movie theater’s countdown clock with the “BUMP” when it hits zero? It is basically that, but applied to economics. (Okay, maybe that’s just me.)
Mathematical Formulation of the Model
Alright, time for a tiny bit of math. Don’t worry, I’ll keep it light. The basic idea is that we’re building a model that looks something like this: Gold Price = Baseline Trend + Impact of Interventions. The “Baseline Trend” is what we expect gold prices to do normally. The “Impact of Interventions” is where the pulse functions come in. We use statistical techniques to estimate how big of an impact each intervention had. It is, in essence, a model that helps us isolate the signal from the noise. Still with me?
Data and Methodology
Data Sources and Collection
To actually use pulse function intervention analysis, you need data. Lots of it! We’re talking historical gold prices (usually daily or weekly), economic indicators (interest rates, inflation, etc.), and a list of potential intervention events. Good sources for this stuff include financial news outlets, government databases, and economic research institutions. The more accurate and comprehensive your data, the better your model will be. Garbage in, garbage out, as they say!
Defining Intervention Events
This is where it gets tricky. You need to carefully define what counts as an “intervention event.” Is it just major geopolitical crises? Or do smaller events, like central bank announcements, also qualify? This is where your judgment as an analyst comes in. You want to choose events that you believe actually had a significant impact on gold prices. It’s a bit of an art and a science.
Model Specification and Estimation
Once you have your data and your list of intervention events, it’s time to build your model. This usually involves using statistical software to estimate the parameters of your model. You’ll need to decide on the specific form of your pulse functions (how long they last, how big their initial impact is) and test different model specifications to see what works best. This is where a good understanding of econometrics comes in handy. Or, you know, a really smart friend who does.
Results and Discussion
Intervention Event Impact Assessment
The fun part! Once your model is built, you can start to see how different intervention events affected gold prices. Did the invasion of Ukraine cause a spike? Did a change in US interest rates lead to a dip? Your model will give you estimates of the size and duration of these impacts. This can provide valuable insights into what factors really drive gold prices.
Model Validation and Accuracy
Of course, you need to make sure your model is actually any good. That means testing it on data it hasn’t seen before. One common technique is to split your data into a training set (used to build the model) and a testing set (used to evaluate its performance). How well does your model predict gold prices in the testing set? This will give you a sense of its accuracy and reliability.
Comparison with Other Forecasting Models
It’s also a good idea to compare your pulse function intervention analysis model with other forecasting methods. How does it stack up against traditional time series analysis or regression models? If your model consistently outperforms the others, that’s a good sign that it’s capturing something important about the dynamics of gold prices.
Limitations and Challenges
Data Availability and Quality
Let’s be real, no forecasting method is perfect. One of the biggest challenges with pulse function intervention analysis is data availability. You need reliable data on both gold prices and potential intervention events. If your data is incomplete or inaccurate, your model will suffer. It’s like trying to build a house with missing bricks.
Model Complexity and Interpretability
Another challenge is model complexity. Pulse function intervention analysis can get pretty complicated, especially if you’re dealing with a lot of intervention events. This can make it difficult to interpret the results and understand exactly why your model is making the predictions it is. You want to avoid a “black box” model where you don’t understand what’s going on inside.
Potential for Overfitting
Finally, there’s the risk of overfitting. This happens when your model is too closely tailored to the specific data you used to build it. An overfitted model will perform well on your training data but poorly on new data. It’s like memorizing the answers to a test instead of actually understanding the material. To avoid overfitting, you need to be careful to keep your model as simple as possible and to validate it rigorously on independent data.
So, there you have it: a whirlwind tour of forecasting gold prices using pulse function intervention analysis. It’s a powerful tool, but it’s not a magic bullet. It requires good data, careful analysis, and a healthy dose of skepticism. Hopefully, this has given you a better understanding of how this method works and what its potential is. Now, go forth and conquer the gold market—or, at least, make more informed decisions. And hey, if you try this out, let me know how it goes! I’m always curious to hear about real-world experiences.